
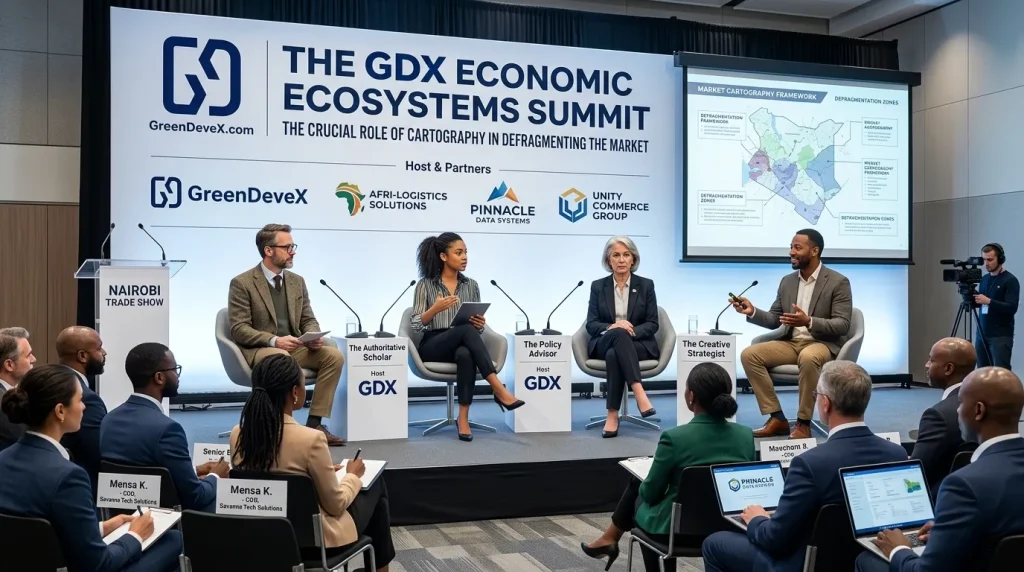
What The Cartographer Does
Core Question: How does everything connect?
The Cartographer resolves market fragmentation by mapping relationships, flows, and systems by making the invisible architecture of ecosystems visible for the first time.
Markets cannot move when no one can see the whole system. Stakeholders are disconnected. Relationships are invisible. Flows are hidden.
The cost?
You make decisions in the dark.
You miss leverage points.
You optimize parts while the system fails.
The Cartographer does not just draw what exists. The Cartographer reveals what the system actually is—so you can decide what it should become.
GreenDeveX classifies authors who embody the Cartographer to help brands see their markets whole. The outcome? Leverage points become visible. Strategic bets are informed. Your brand navigates with a map.
Ideal Characteristics of The Cartographer
| # | Characteristic | What It Looks Like |
|---|---|---|
| 1 | Systems Orientation | Sees relationships, not just nodes. Understands that the map is about connections, not just dots. |
| 2 | Relational Intelligence | Intuits who matters, who depends on whom, where power sits. Maps are social, not just spatial. |
| 3 | Data Aggregation Instinct | Pulls from multiple sources. Knows that the truth is in the synthesis. |
| 4 | Visual Clarity | Can make complex systems legible. The map reveals, not obscures. |
| 5 | Leverage Point Instinct | Looks for the place where a small change produces a big effect. Maps are strategic, not just descriptive. |
| 6 | Humility About Boundaries | Knows that every map is incomplete. Chooses what to include and what to leave out deliberately. |
| 7 | Collaborative Orientation | Builds maps with stakeholders, not for them. The process is as valuable as the product. |
Real-Life Example:
Jane Jacobs
Jane Jacobs (1916-2006), the urbanist, writer, and activist, is a definitive example of The Cartographer archetype in action.

Why she embodies The Cartographer:
| Characteristic | How Jane Jacobs Demonstrates It |
|---|---|
| Systems Orientation | Her masterpiece, The Death and Life of Great American Cities, mapped the social and economic systems that make neighborhoods thrive or fail. She saw cities as ecosystems, not just collections of buildings. |
| Relational Intelligence | She showed that sidewalks, parks, and streets are not just infrastructure—they are stages for human relationships. Safety, commerce, and community emerge from those relationships, not from design alone. |
| Data Aggregation Instinct | She walked the streets. She observed. She talked to shopkeepers, parents, and police. Her data came from lived experience, synthesized into patterns. |
| Visual Clarity | Her prose is a map. She guides the reader through the neighborhood, pointing out what to notice, what matters, and what connects to what. |
| Leverage Point Instinct | She identified that mixed-use zoning, short blocks, and aged buildings were leverage points for vibrant neighborhoods. Small policy changes could produce big effects. |
| Humility About Boundaries | She knew her map was partial. She focused on a few neighborhoods, a few cities. She did not claim universality, but the patterns were striking. |
| Collaborative Orientation | Her activism was grounded in community mapping. She organized neighbors to oppose highway construction that would fragment neighborhoods. The map was built with those who lived it. |
How Jacobs resolves market fragmentation:
Before Jacobs, urban planners saw cities as machines to be optimized—traffic flow, zoning, efficiency.
She mapped the hidden system: the relationships, the unintended consequences, the emergent order. Once you see the map, you cannot unsee it.
Fragmentation gives way to understanding.
The GreenDeveX Insight:
Brands that partner with Cartographers like Jane Jacobs do not need to guess where to intervene in complex systems.
The Cartographer reveals the leverage points. The brand simply needs to act on them.
Other Notable Cartographers for Inspiration
| Cartographer | Domain | Why They Qualify |
|---|---|---|
| W.E.B. Du Bois | Race & Inequality | His data visualizations at the 1900 Paris Exposition mapped Black life in America at a time when it was deliberately invisible. He made the system visible through charts, graphs, and maps. |
| Minard’s Map of Napoleon’s March (Charles Joseph Minard) | War & Logistics | The most famous statistical graphic ever made. It maps the catastrophic loss of Napoleon’s army in Russia: direction, location, temperature, and army size—all in one image. A single map that tells a story. |
| Ruthlessly Useful Maps (Analytical Cartography) | Strategic Visualization | Not a person, but a tradition. Maps that are not decorative—they are analytical. They reveal what you need to know and hide what you do not. |
| Christopher Alexander | Architecture & Design | His Pattern Language mapped the recurring patterns that make spaces work. He showed that design problems are not unique—they recur, and the patterns can be mapped. |
| Donella Meadows | Systems Dynamics | Her work on leverage points is essential reading for any Cartographer. She mapped where to intervene in a system—from changing parameters to transforming goals. |
| Ben Fry | Data Visualization | Co-creator of Processing, a programming language for visual artists. His work makes complex data legible. He is a Cartographer of the digital age. |
The Market Fragmentation Friction
What the friction looks like:
Markets cannot move when no one can see the whole system. Stakeholders are disconnected. Relationships are invisible. Flows are hidden. Decisions are made with partial information.
The cost of this friction:
- You make decisions in the dark. Without a map, you are guessing.
- You miss leverage points. The place where a small change would produce a big effect is invisible.
- You optimize parts while the system fails. Improving one node while ignoring the network can make things worse.
- Stakeholders are surprised by each other’s actions. No one sees the whole picture.
- Resources are wasted on interventions that cannot work because the system is misunderstood.
- Competitors with better maps capture opportunities you could not see.
How The Cartographer resolves it:
The Cartographer does not just draw what exists. The Cartographer reveals what the system actually is—so you can decide what it should become.
Through systems orientation, relational intelligence, and leverage point instinct, the Cartographer makes fragmentation visible so it can be addressed.
The mechanism: Visibility transfer.
The Cartographer does the work of mapping so that others can see. The map becomes the shared reference that aligns stakeholders.
Questions The Cartographer Helps Markets Answer
| # | Question |
|---|---|
| 1 | What does the whole system look like? Who is connected to whom? |
| 2 | Where does value flow? Where are the bottlenecks? |
| 3 | Where is the leverage point? Where does a small change produce a big effect? |
| 4 | What are the unintended consequences of intervening here? |
| 5 | What relationships are missing that should exist? |
Publishing Formats for The Cartographer
| Format | Why It Works for The Cartographer |
|---|---|
| Ecosystem Maps | Visualizes the whole system. Shows nodes, connections, flows, and bottlenecks. |
| Network Diagrams | Focuses on relationships. Reveals who is connected (and who is not). |
| Flow Charts | Shows how value, information, or resources move through the system. |
| Leverage Point Analyses | Identifies where to intervene. Maps the system to find the high-leverage nodes. |
| Journey Maps | Shows the stakeholder experience over time. Reveals friction points. |
| Data Visualizations | Makes quantitative relationships visible. A chart can be a map. |
Ideal Industries / Sectors
| Sector | Why The Cartographer Thrives Here |
|---|---|
| Strategy & Consulting | Strategy requires system understanding. Cartographers provide the map. |
| Policy & Governance | Policies affect systems. Cartographers map the likely effects—and unintended consequences. |
| Supply Chain & Logistics | Supply chains are networks. Cartographers reveal bottlenecks and risks. |
| Technology Platforms | Platforms are ecosystems. Cartographers map the participants, flows, and dependencies. |
| Nonprofit & Social Impact | Social problems are system problems. Cartographers map the leverage points for change. |
| Ecosystem Design | New ecosystems need to be architected. Cartographers design the map before the reality. |
Ideal Brand Partnerships
| Brand Type | Why They Need The Cartographer |
|---|---|
| Strategy consultancies | Need maps to inform recommendations. Cartographers provide the foundation. |
| Policy organizations | Need to understand system effects before advocating change. Cartographers map the system. |
| Supply chain operators | Need to see the whole network—risks, dependencies, bottlenecks. Cartographers provide visibility. |
| Platform businesses | Need to understand their ecosystem. Cartographers map participants and relationships. |
| Impact investors | Need to identify leverage points for system change. Cartographers reveal where capital has the greatest effect. |
5 Frequently Asked Questions About The Cartographer
FAQ 01: Is The Cartographer just a data visualizer?
Data visualizers turn data into pictures. Cartographers map systems.
The difference is orientation: one is about representation; the other is about understanding.
Cartographers ask, “What is the system?”
Data visualizers ask, “How should this data look?”
There is overlap, but the intent differs.
FAQ 02: How does The Cartographer differ from The Operator?
The Operator builds systems. The Cartographer maps them. One is constructive; one is descriptive. They are natural partners: you cannot build what you cannot see; the map guides the building..
FAQ 03: Does The Cartographer need technical skills (e.g., coding, GIS)?
Not necessarily. Many great Cartographers map with words, not software. The map is in the prose.
What matters is the systems thinking, not the tool.
FAQ 04: Can The Cartographer also be a Storyteller?
Yes. The best Cartographers tell stories through their maps.
A map without a narrative is just a picture.
The Storyteller-Cartographer helps audiences not just see the map but understand what it means.
FAQ 05: What makes a map valuable?
Clarity and insight. A valuable map reveals something you could not see before. It does not just catalog what you already know.
It shows you the leverage point, the hidden connection, the emergent pattern. If the map does not surprise you, it is not valuable.
Example in Action
Scenario:
A regional economic development organization wants to grow the local tech sector.
They have tried tax incentives, incubators, and marketing campaigns. Nothing works. They cannot understand why.
The Cartographer intervention:
The Cartographer spends three months mapping the local tech ecosystem. They interview founders, investors, universities, and service providers. They map the flow of talent, capital, information, and customers.
They discover that the bottleneck is not capital or talent—it is serial founders.
The region has no experienced entrepreneurs who have built and sold companies and are now investing their time and capital in the next generation
Outcome:
The organization shifts its strategy from tax incentives to founder retention. They create programs to keep successful entrepreneurs engaged locally.
The Cartographer’s map revealed the true leverage point.
The region starts growing.
Does your brand need The Cartographer?
If market fragmentation is keeping you from seeing the whole system, The Cartographer archetype may be your match.
GreenDeveX classifies and connects Cartographers to brands that need ecosystem visibility and strategic clarity.
Your ecosystem strategy starts here.
→ Join the Early Access Waitlist
→ Find Your Cartographer Match
Now that you understand The Cartographer, explore The Diplomat — the archetype that creates alignment among competing stakeholders.
→ Explore All Author Archetypes