
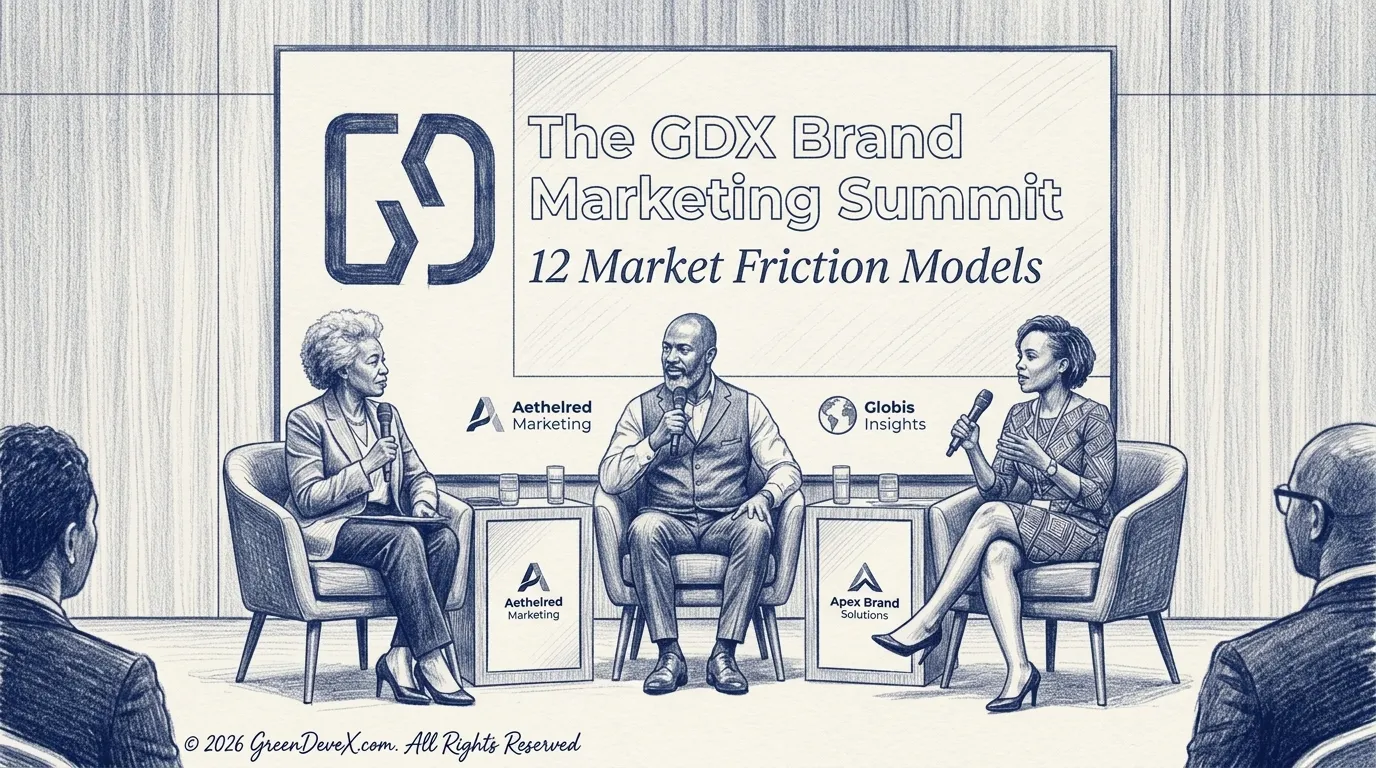
The Market Friction Model explains how to diagnose decision barriers in complex markets and map them to structured author roles that reduce friction and accelerate adoption.
WHAT MARKET FRICTION MEANS
Market friction is the resistance that delays or prevents decisions.
It appears when stakeholders cannot move from awareness to action with confidence.
Research from McKinsey & Company shows that complex buying environments with more than five stakeholders experience decision delays exceeding 40% compared to simpler transactions.
This delay is not caused by a sheer lack of information. It is caused by a misaligned understanding.
WHY FRICTION EXISTS
Friction forms when three conditions overlap:
- Information is available, but not interpreted consistently
- Stakeholders evaluate risk differently
- No single source aligns all perspectives
According to Gartner, 77% of B2B buyers describe their purchase process as extremely complex or difficult, largely due to conflicting internal viewpoints.
This makes friction structural, not situational.
THE COST OF UNADDRESSED MARKET FRICTION
Each friction type corresponds to a specific breakdown in how markets process information.
| Friction | Short-Term Cost | Long-Term Cost |
|---|---|---|
| Trust Deficit | Longer sales cycles | Inability to command premium pricing |
| Complexity | More explanations needed | Commoditization of your offer |
| Fear of Change | Prospect hesitation | Market inertia works against you |
| Stakeholder Conflict | Internal gridlock | Missed partnership windows |
| Market Fragmentation | Inefficient outreach | Competitors consolidate while you fragment |
| Adoption Challenges | High support costs | Low retention and advocacy |
| Cultural Disconnect | Wasted marketing spend | Reputation damage in key markets |
| Information Overload | Content goes unseen | Your signal buried in noise |
HOW THE MARKET FRICTION MODEL OPERATES
The Market Friction Model follows a structured diagnostic sequence:
Step 1: Detect Friction Signals
Observe where decisions slow, stall, or reverse.
Step 2: Classify Friction Type
Map each signal to one of the 12 friction categories.
Step 3: Quantify Impact
Measure delays in:
Step 4: Assign Resolution Layer
Each friction type is associated with a specific author archetype and publishing approach.
6 FRICTION POINTS OF ARCHETYPE MAPPING
Trust Intelligence
Trust reduces acquisition costs, increases conversion rates, and improves stakeholder confidence.
| Archetype | Solves | Inspiring Example |
|---|---|---|
| Sage | Trust Deficit | Oprah Winfrey |
| Historian | Short-Term Thinking | David McCullough (1933-2022) |
| Investigator | Public Skepticism | Ida B. Wells (1862-1931 |
Adoption Intelligence
Adoption determines whether ideas, products, and systems become useful.
| Archetype | Solves | Inspiring Example |
|---|---|---|
| Field Guide | Implementation Fear | |
| Translator | Complexity | |
| Operator | Execution Waste |
Influence Intelligence
Influence shapes loyalty, retention, memory, and participation.
| Archetype | Solves | Inspiring Example |
|---|---|---|
| Storyteller | Emotional Distance | Maya Angelou (1928-2014) |
| Evangelist | Weak Loyalty | Tony Robbins |
| Community Builder | Isolation | Priya Parker |
Market Intelligence
Markets change before most organizations notice.
These author archetypes help brands understand what is happening.
| Archetype | Solves | Inspiring Example |
|---|---|---|
| Futurist | Fear of Irrelevance | James Cameron |
| Cultural Decoder | Cultural Disconnect | Chimama Ngozi |
| Economist | Market Misunderstanding | Michael Lewis |
| Curator | Information Overload | Maria Popova |
Strategic Positioning Intelligence
Positioning determines how markets perceive a brand.
| Archetype | Solves | Inspiring Example |
|---|---|---|
| Contrarian | Category Sameness | Niall Ferguson |
| Philosopher | Purpose Ambiguity | Cornel West |
| Antagonist | Strategic Blind Spots | George Orwell |
Ecosystem Intelligence
Organizations increasingly compete as ecosystems rather than individual companies.
| Archetype | Solves | Inspiring Example |
|---|---|---|
| Cartographer | Ecosystem Fragmentation | Jane Jacobs (1916-2006) |
| Diplomat | Stakeholder Misalignment | Kofi Annan |
HOW BRANDS APPLY THIS MODEL
Brands use the GreenDevex Market Friction model as a diagnostic and planning tool:
This replaces reactive marketing with predictable influence systems.
How to Diagnose Your Market Friction
Not sure which friction is slowing your growth? Ask yourself these questions:
| Question | Likely Friction |
|---|---|
| How long does it take a new prospect to trust your claims without external validation? | Trust Deficit |
| Can your best customer explain your value to a peer in two sentences? | Complexity |
| What are the top three reasons qualified prospects decline to move forward? | Fear of Change |
| How often does internal disagreement delay or derail a partnership or purchase decision? | Stakeholder Conflict |
| Are the key stakeholders in your market talking to each other? Do they share a common language? | Market Fragmentation |
| What percentage of qualified prospects who understand your value still fail to convert? | Adoption Challenges |
| Does your market narrative resonate differently across cultural or regional contexts? | Cultural Disconnect |
| Is your best content being found and read by the decision-makers who need it most? | Information Overload |
WHAT CHANGES WHEN FRICTION IS REMOVED
When friction is reduced systematically:
According to Forrester, organizations that reduce decision friction see measurable gains in conversion efficiency and retention outcomes.
Ready to diagnose your market friction?
Map your specific friction profile and get a matched archetype recommendation before building any publishing infrastructure.
Your Ecosystem transition starts here.
→ Join the Early Access Waitlist
→ Explore Brand–Author Ecosystems
→ Explore Author Archetypes